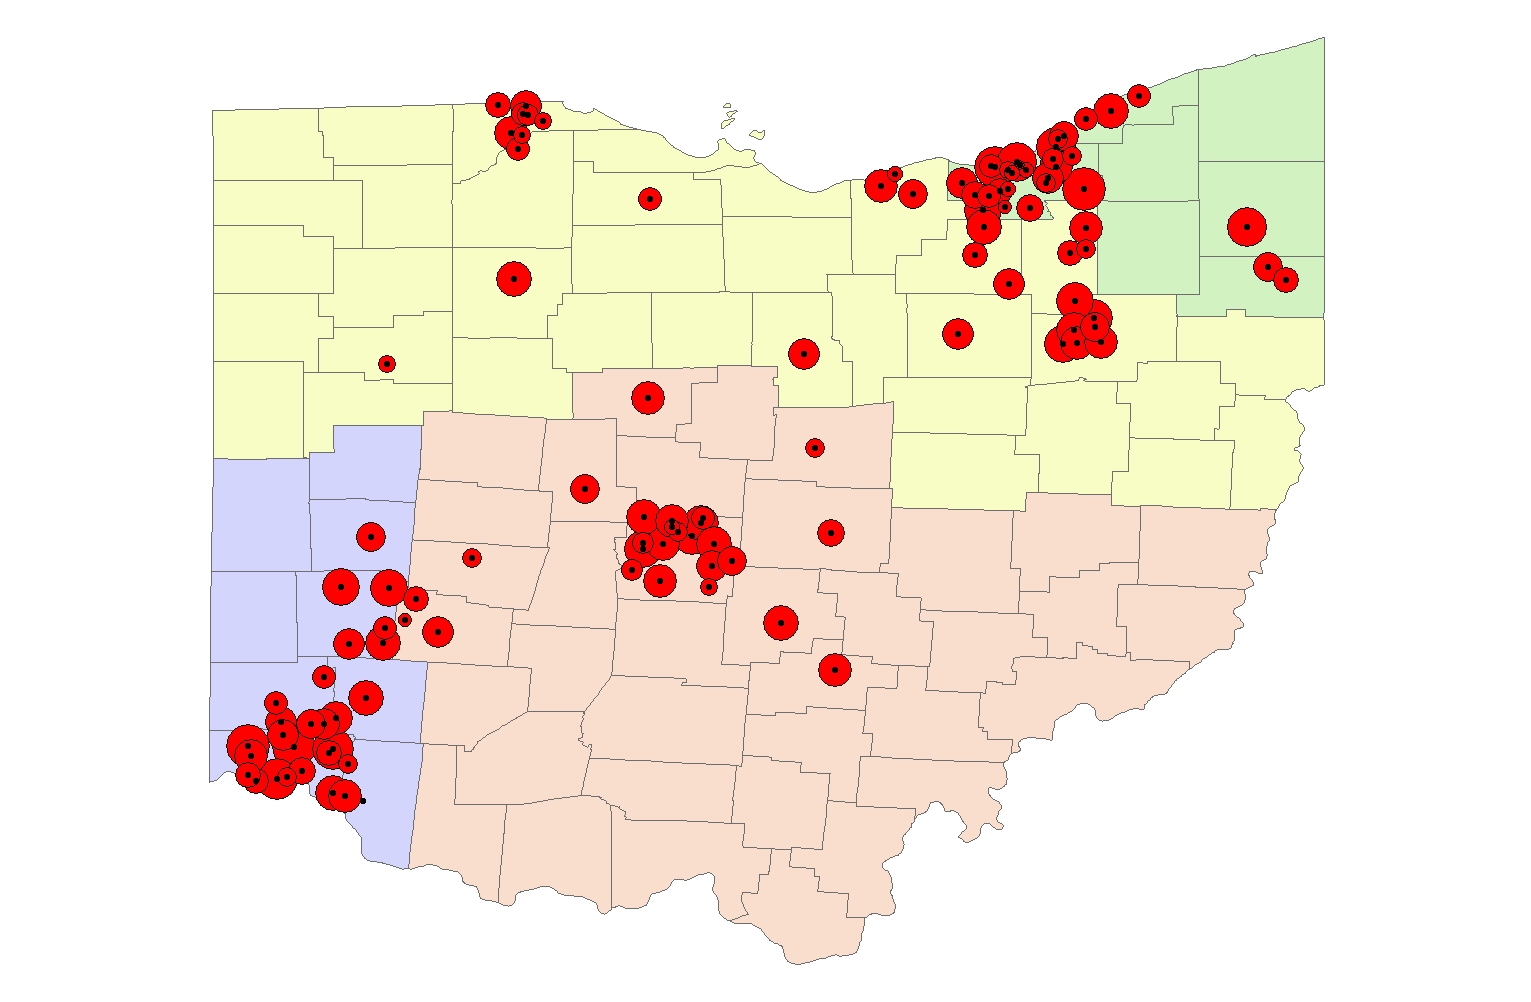
Division 1
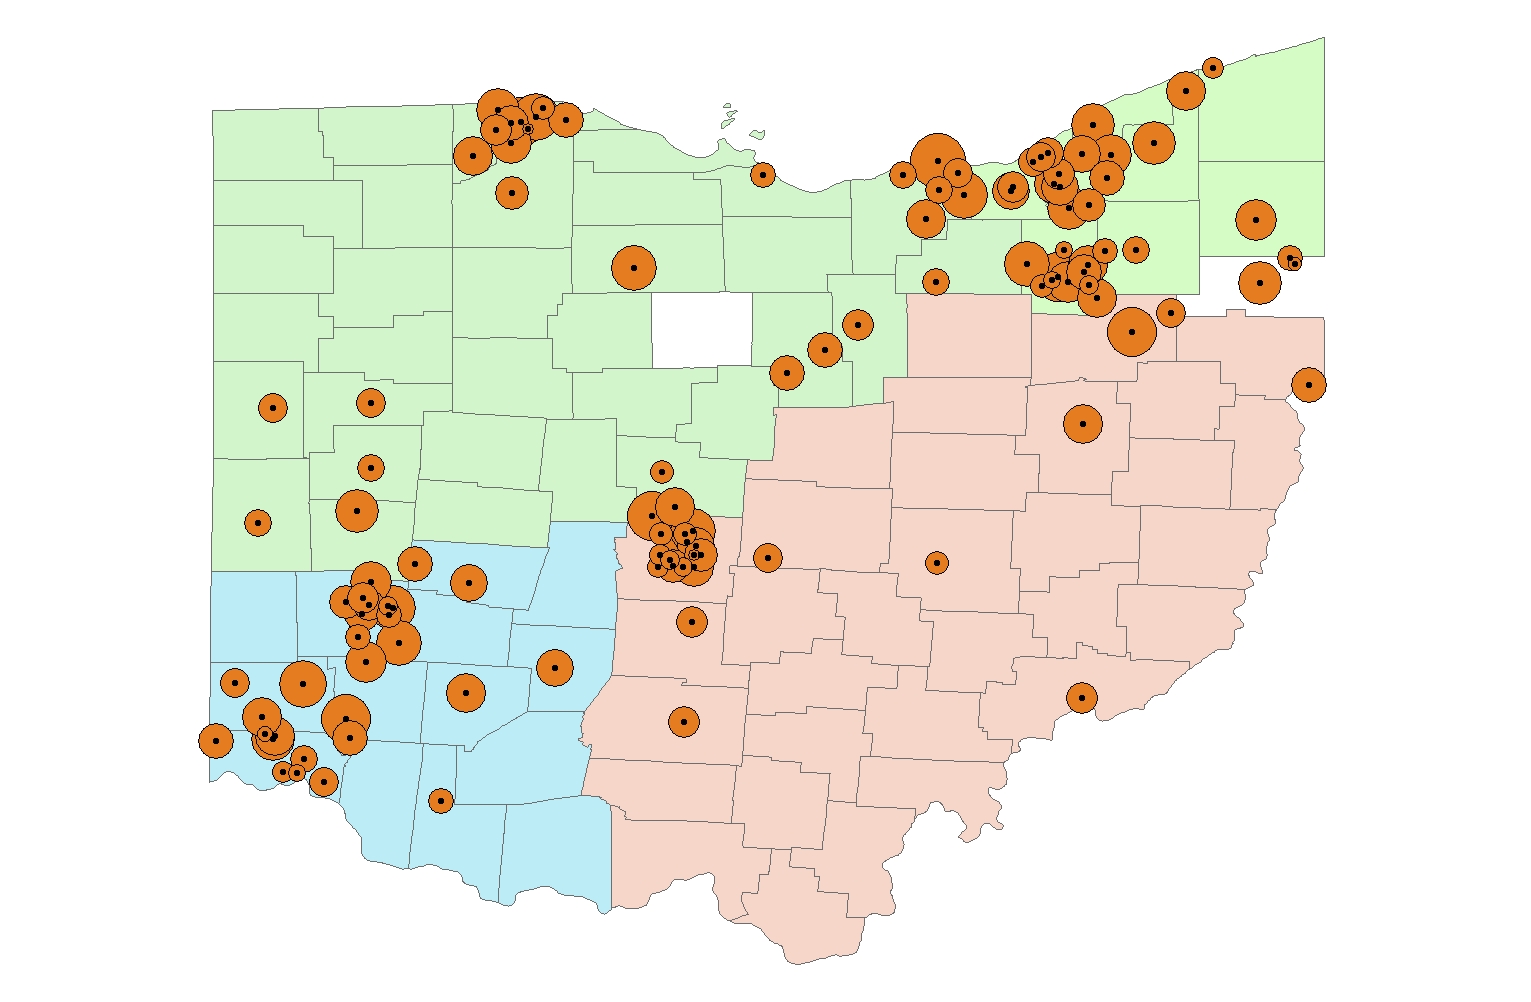
Division 2
Top Teams Over Last Six Seasons
2000-2005
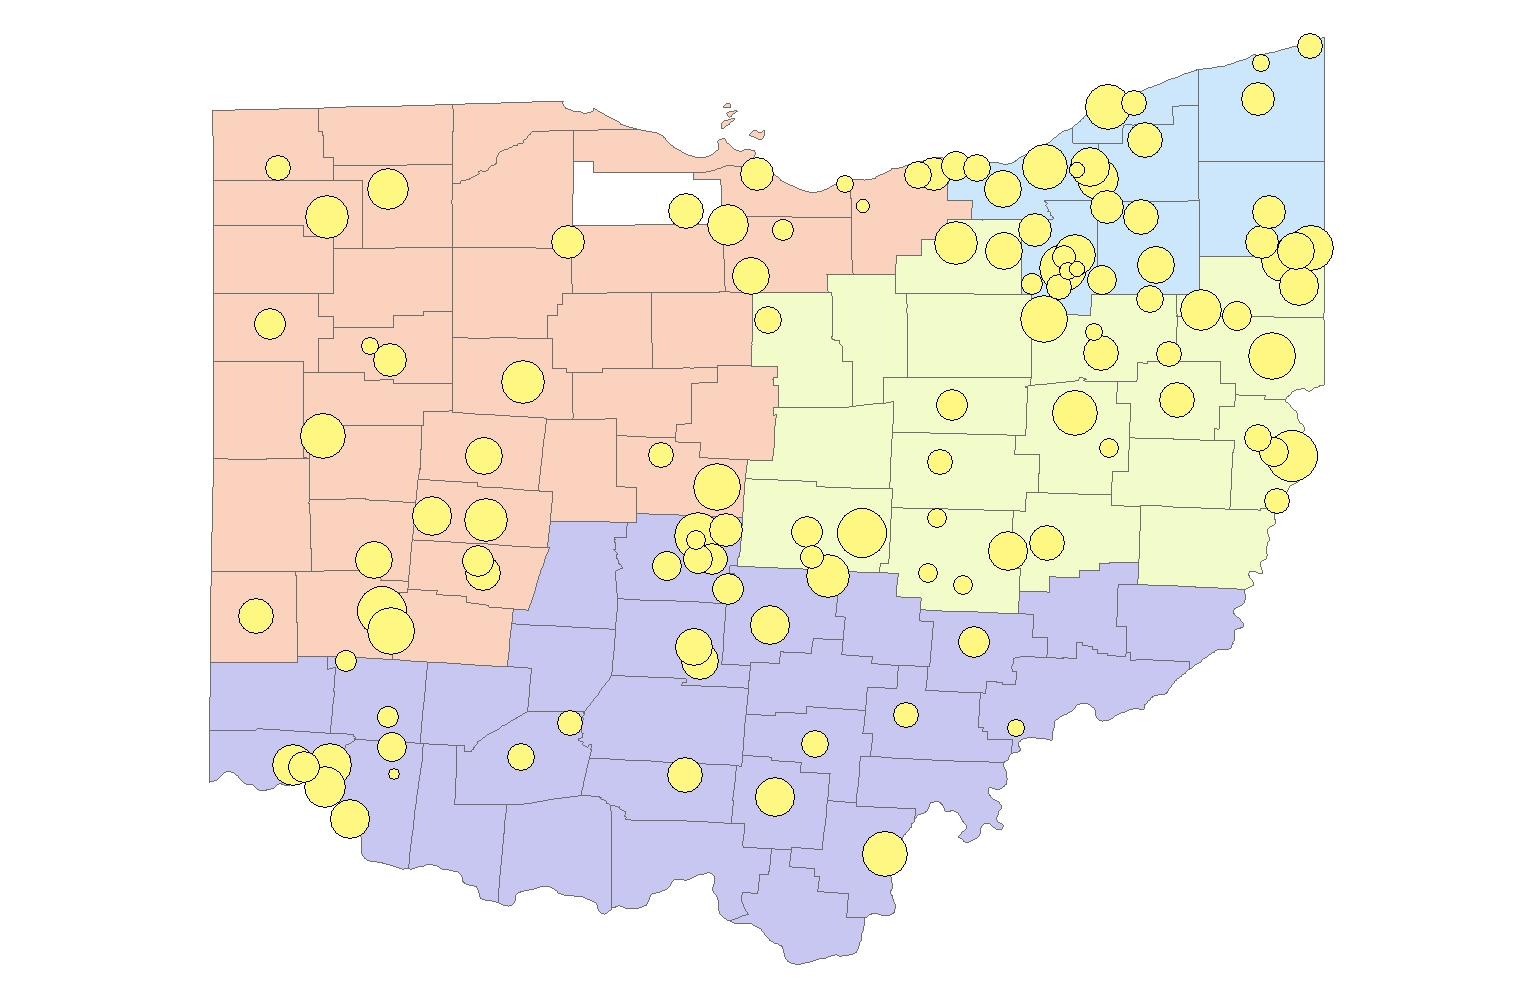
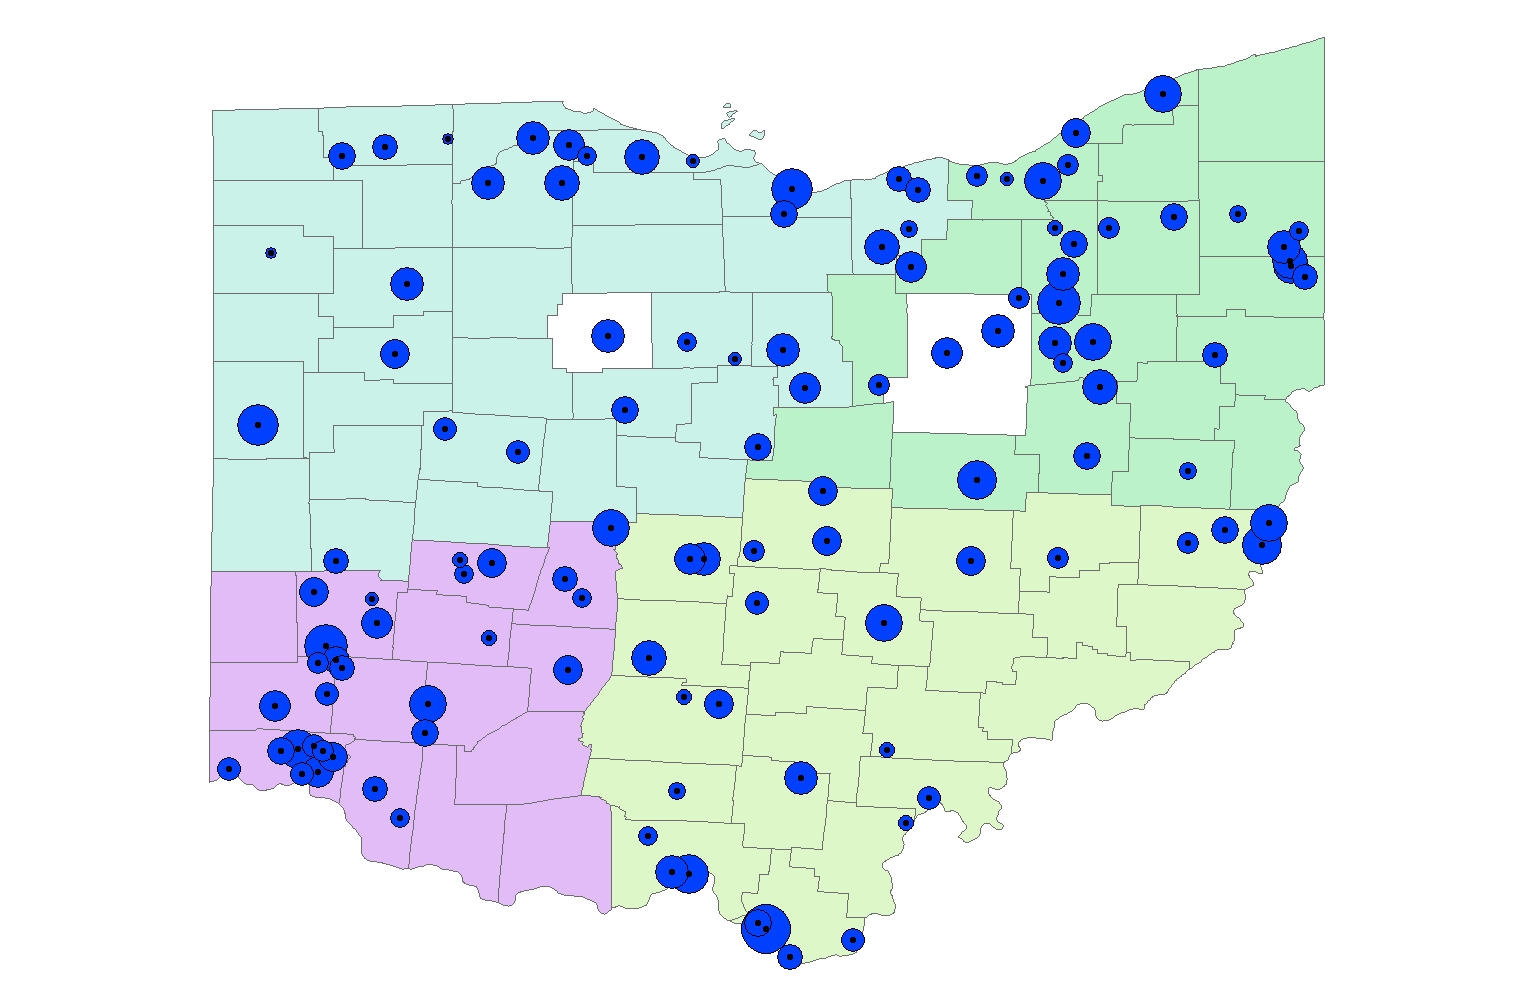
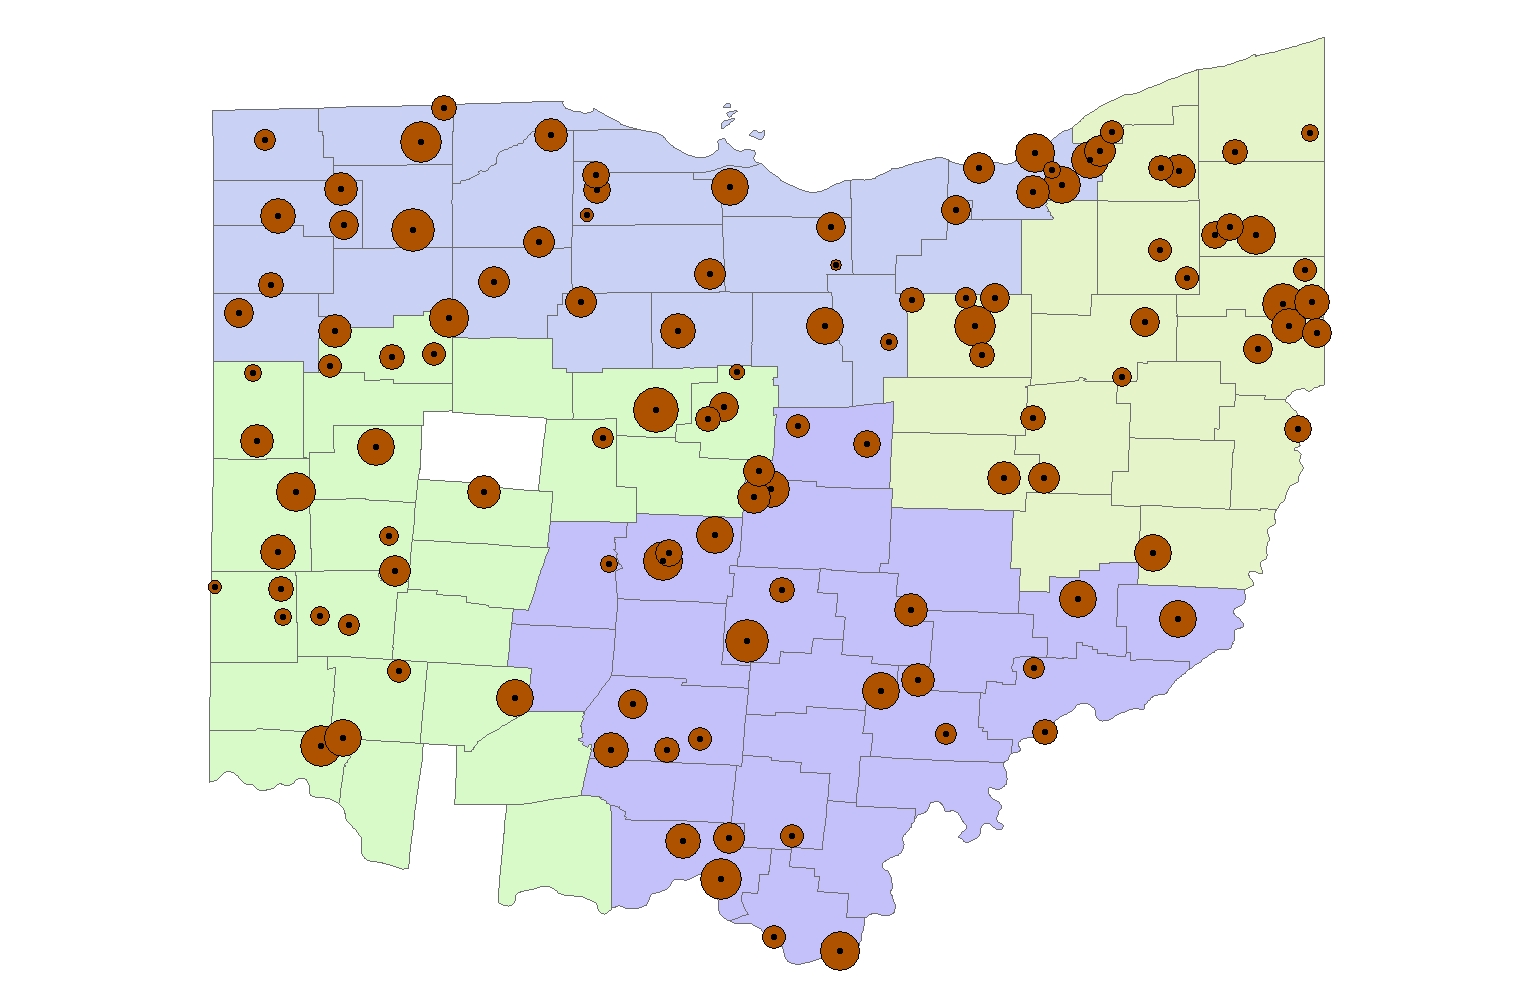
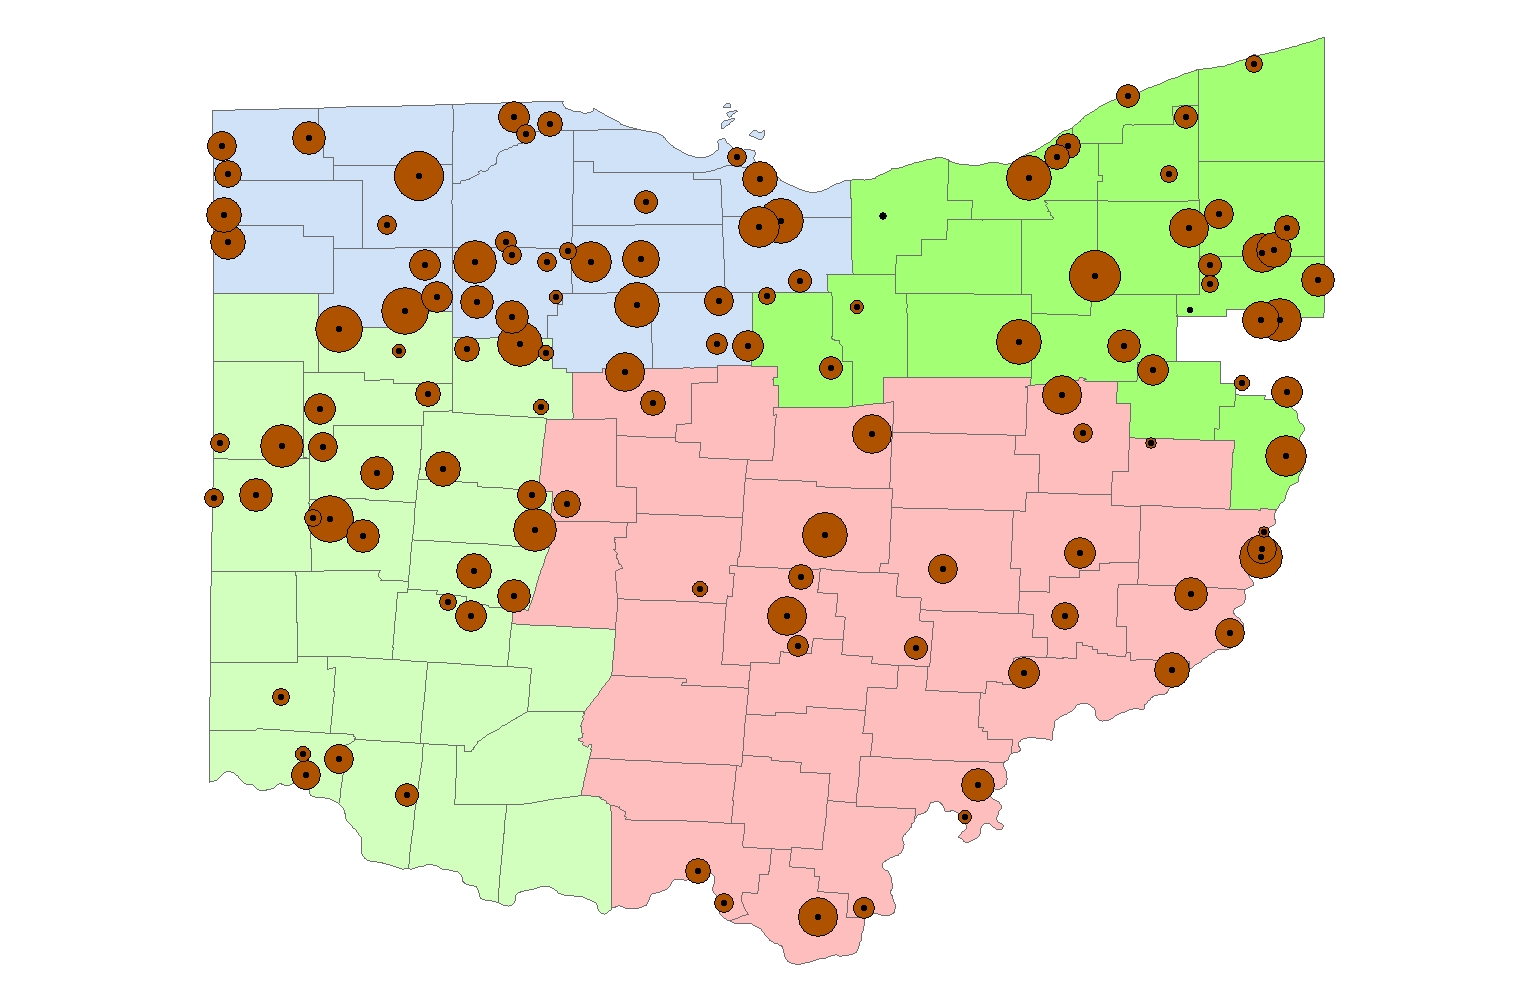
Methodology: This analysis uses average computer points per week over the past six seasons to compare the top performing high school football teams during the regular season over this period. Since larger schools are likely to have higher computer point scores, this analysis divides the teams by division (and further by region) based on the team's regional membership in 2005. Only teams that have fielded a football team during each of the the six seasons are included. Any map included in this section shows the average computer point score by circle size. Larger circles indicate better performing teams.
|
Division 1 |
Division 2 |
|
|
|
|
Division 3 |
Division 4 |
|
|
|
|
Division 5 |
Division 6 |
|
|
|
Ohio Sports Geography Discussion Board
Any questions, comments, suggestions, or corrections: e-mail me