Division 1
Division 2

Most Consistent Teams Over Last Six Seasons
2000-2005
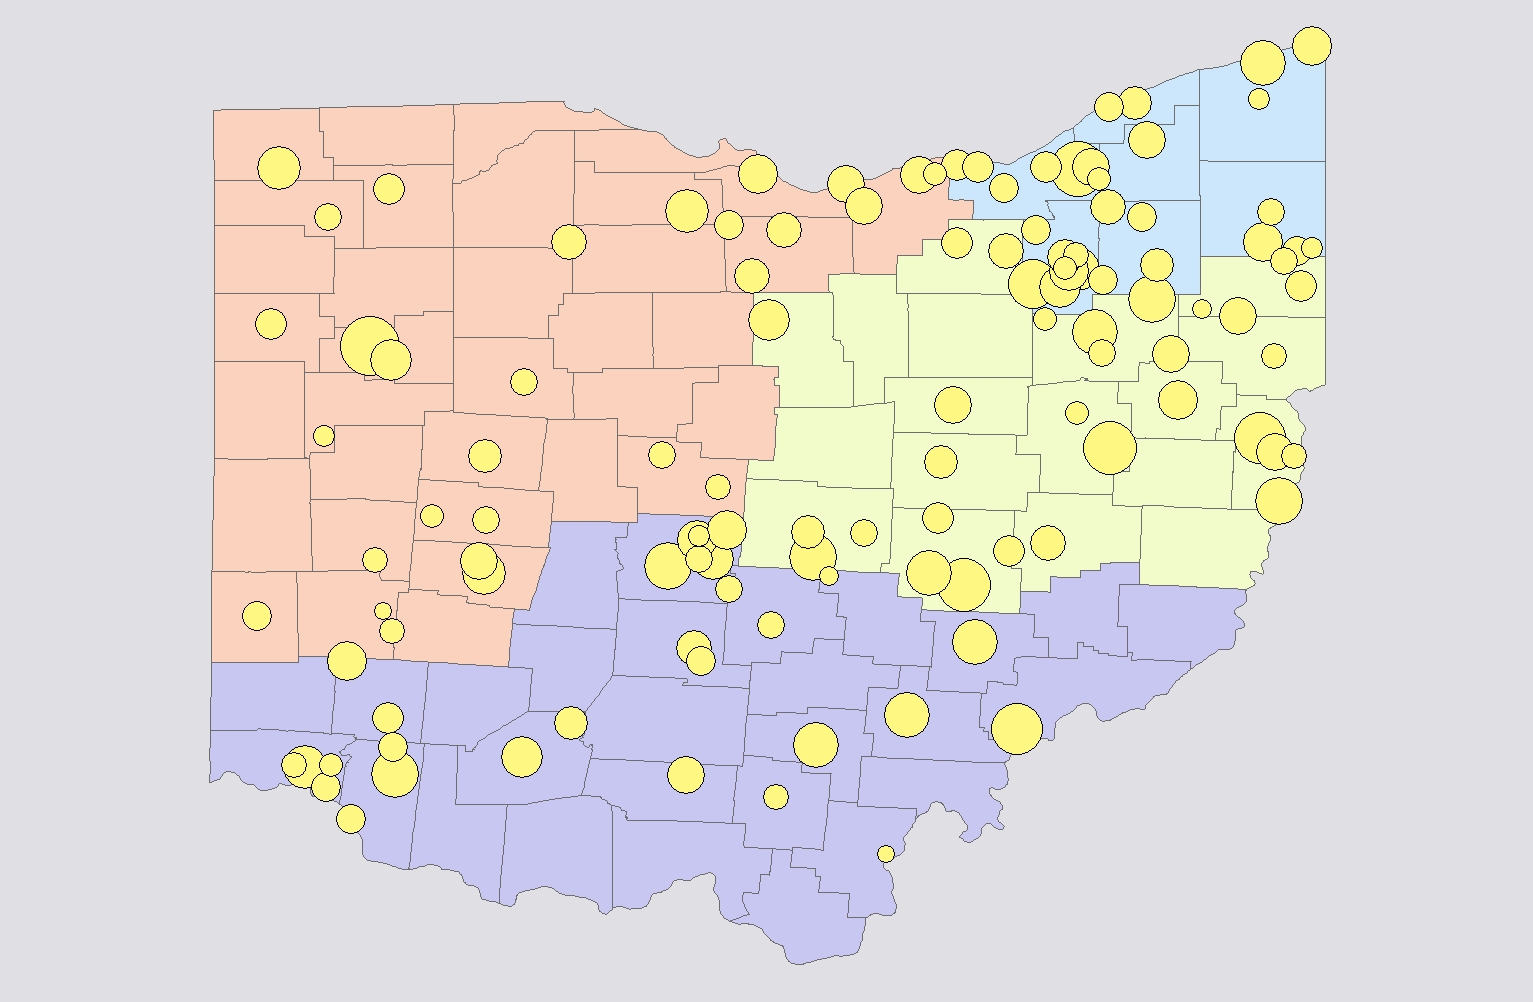
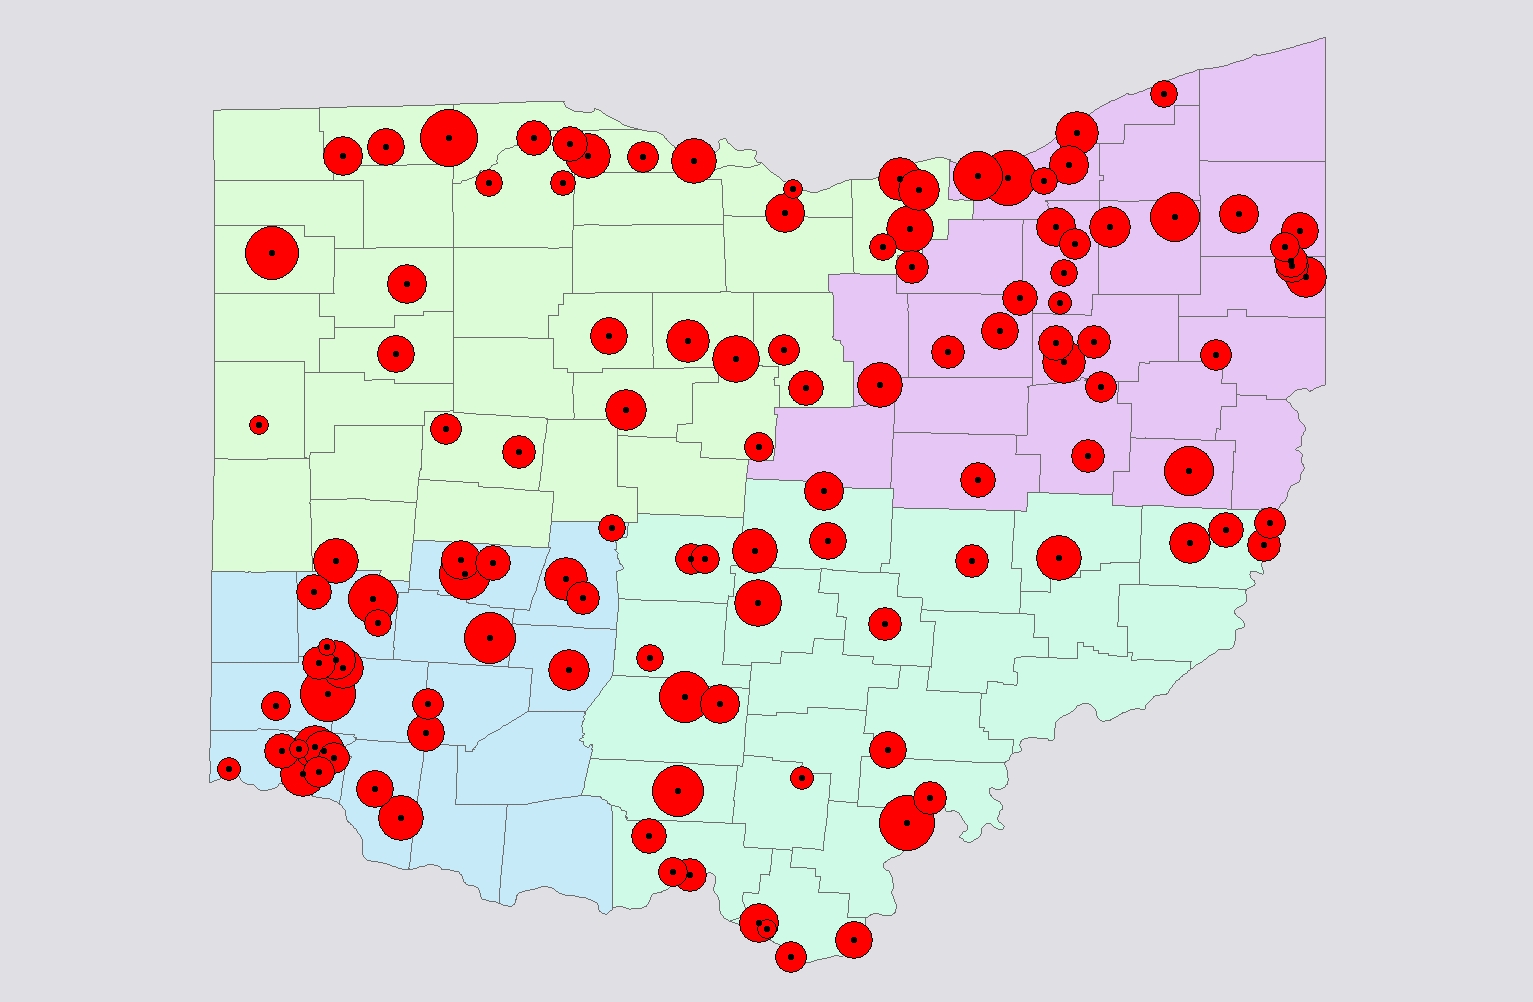
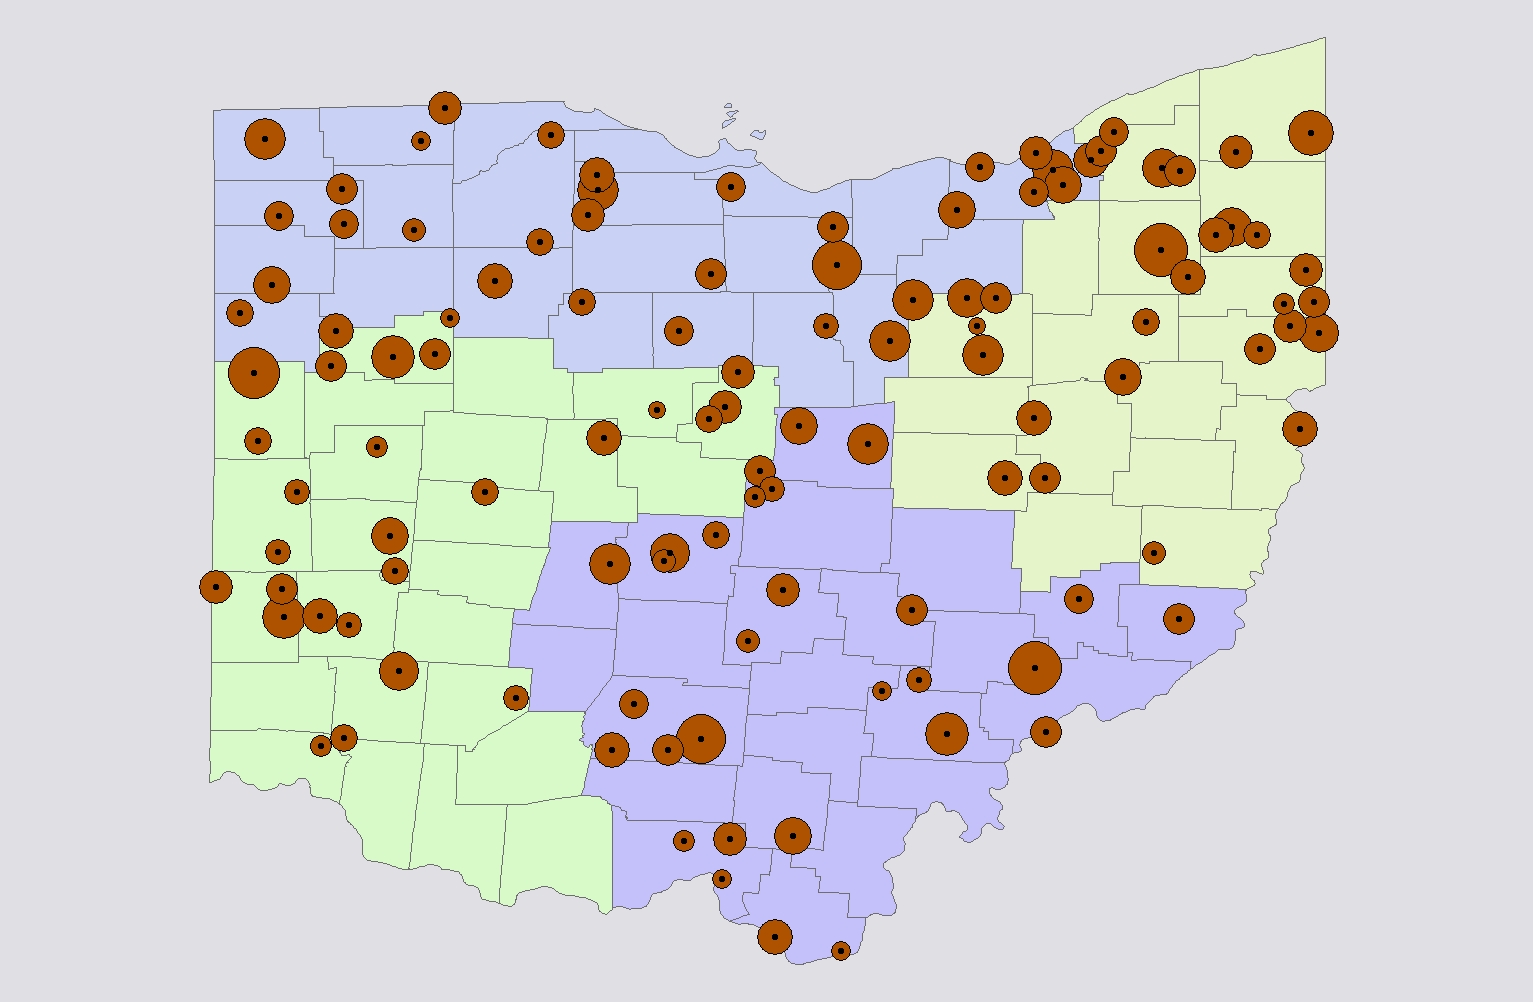
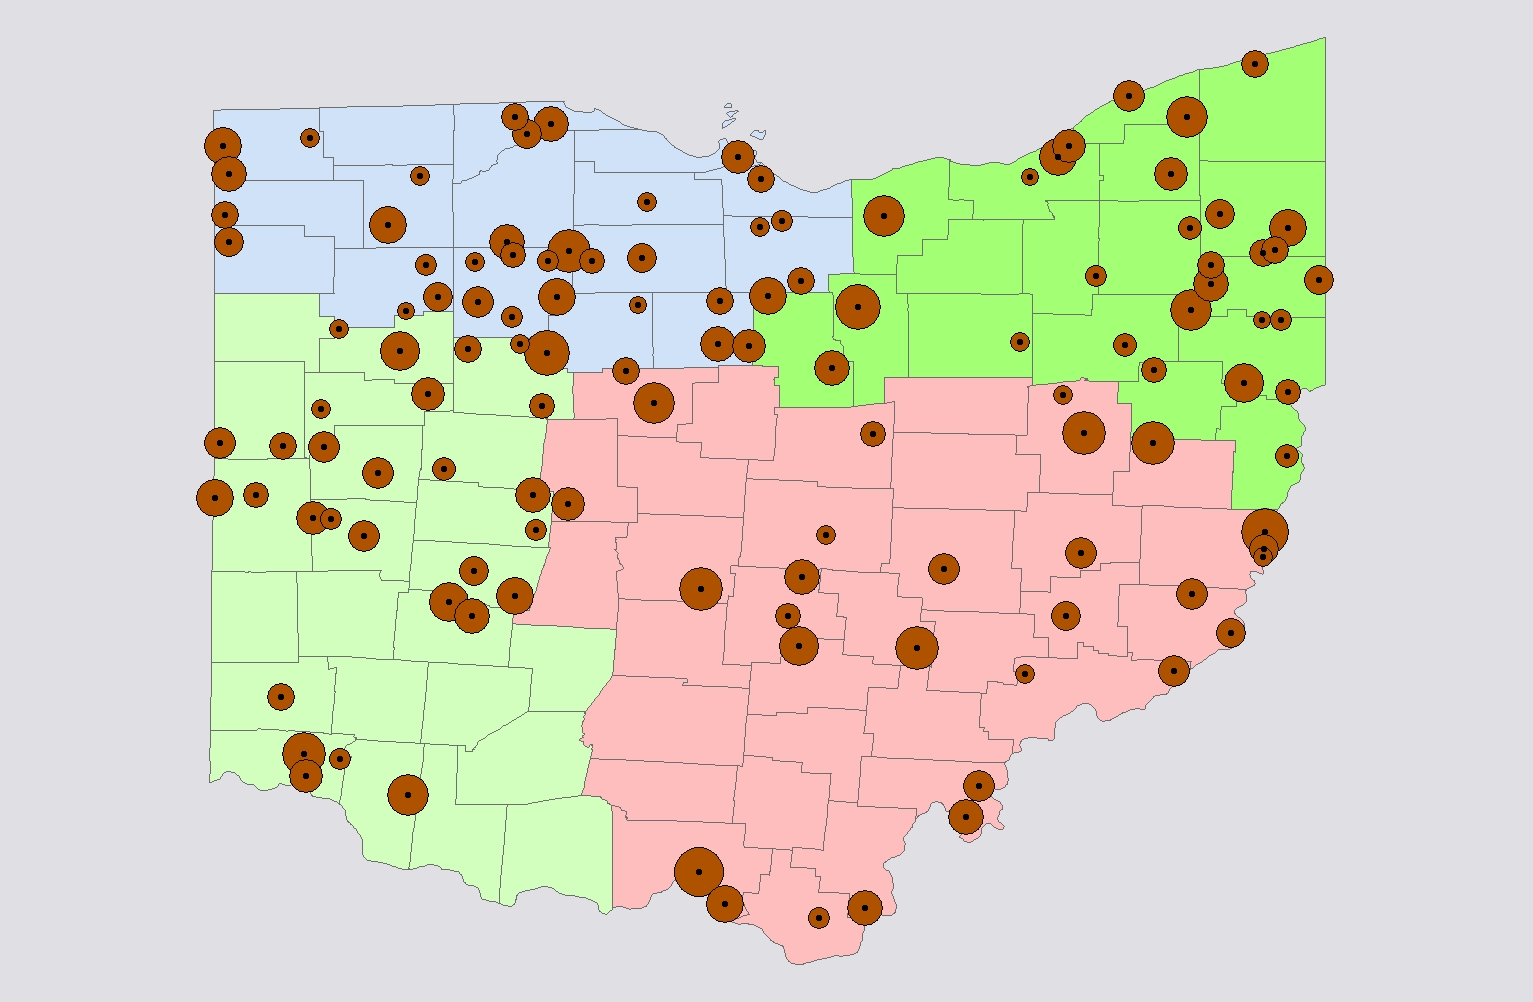
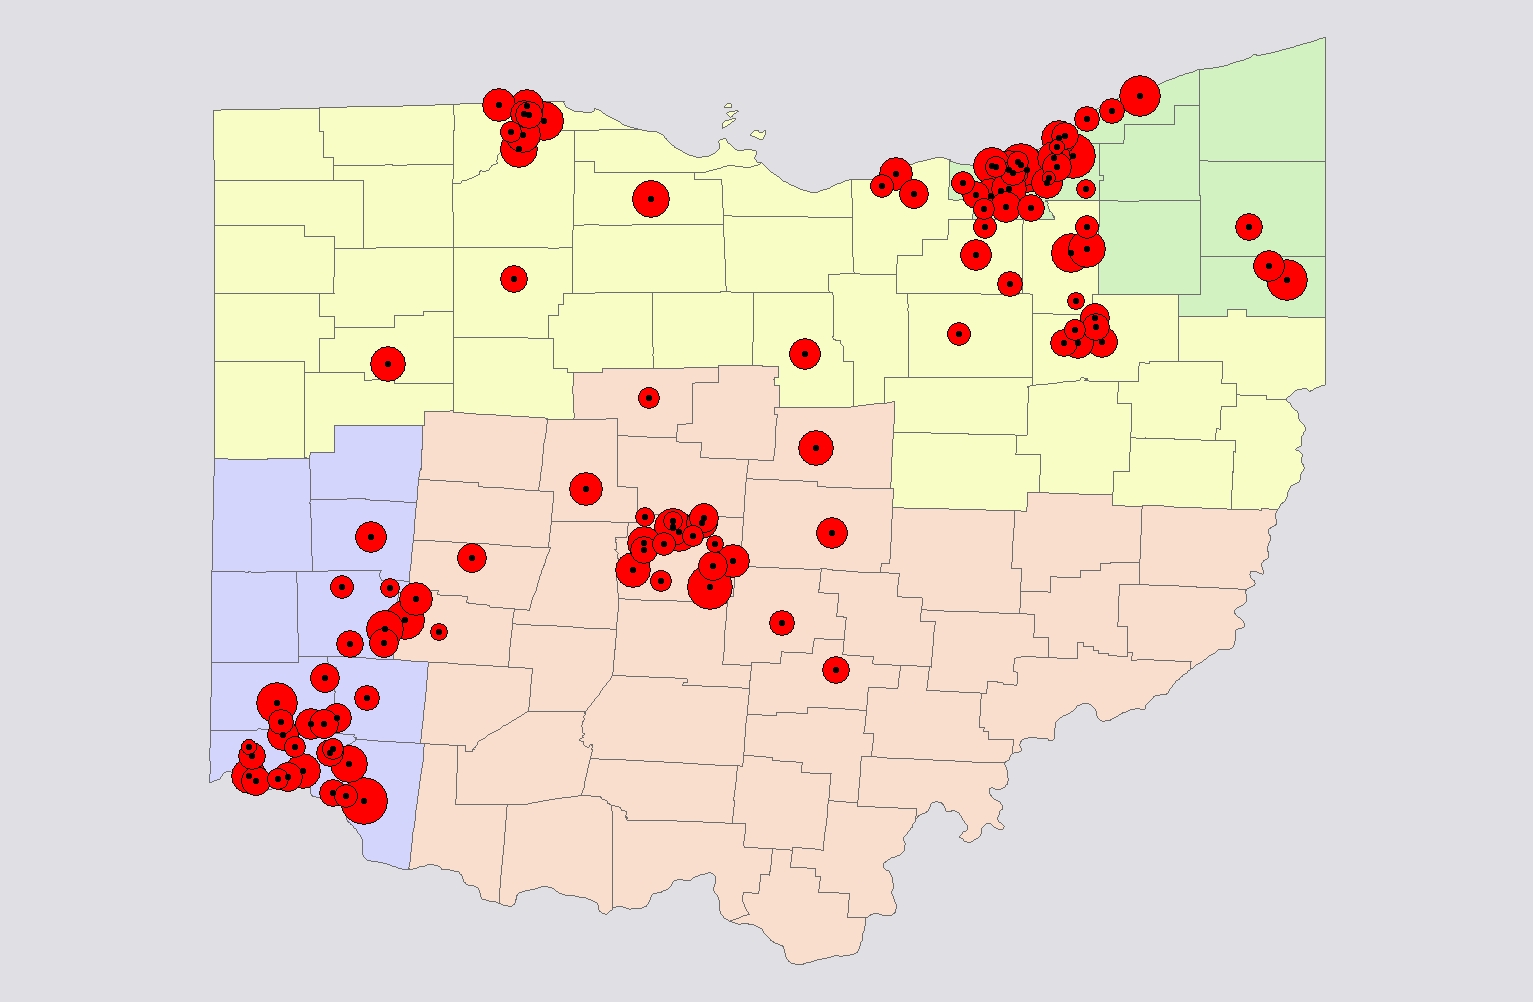
Methodology: This analysis uses the standard deviation and standard error of computer points per week over the past six seasons to compare the most consistent high school football teams during the regular season over this period. The larger the standard deviation, the less consistently the school has performed from year to year. Since schools with high average computer points will likely have higher standard deviation scores, this analysis also provides standard error of the mean scores. The analysis divides the teams by division (and further by region) based on the team's regional membership in 2005. Only teams that have fielded a football team during each of the the six seasons are included. Any map included in this section displays the standard error of the mean, therefore, smaller circles indicate more consistent performance.
By using standard error of the mean, we can normalize the statistics so that the magnitude of the computer point score does not matter. Therefore, a comparison of all teams, regardless of division makes sense. Click here to see a list of all schools. Or click below to see the division of your choice.
|
Division 1 |
Division 2 |
|
|
|
|
Division 3 |
Division 4 |
|
|
|
|
Division 5 |
Division 6 |
|
|
|
Ohio Sports Geography Discussion Board
Any questions, comments, suggestions, or corrections: e-mail me